Written by Indira Bose, Claire Dooley, Sara Viviani, Carlo Cafiero, Hilary Bethancourt, Edward Frongillo, Sera Young
“Water is life, water is food”; so goes the theme of this year’s World Food Day. Although the connections between water and food insecurity have received surprisingly little attention, water and food insecurities seem to be tightly coupled. For one, there are many plausible pathways that link the two, from food production to food preparation and beyond. Empirical evidence that the two go hand-in-hand has also recently begun to emerge. The experiences of water insecurity and food insecurity are strongly correlated in communities around the world, as well as in nationally representative samples. For example, using data from the 2020 Gallup World Poll, the odds of experiencing moderate-to-severe food insecurity were found to be nearly three times as high amongst those experiencing moderate-to-severe water insecurity as those who were water secure or only mildly water insecure. However, the exact nature of the relationship is not clear. Which mechanisms drive this association? Does the physical environment modify this relationship?
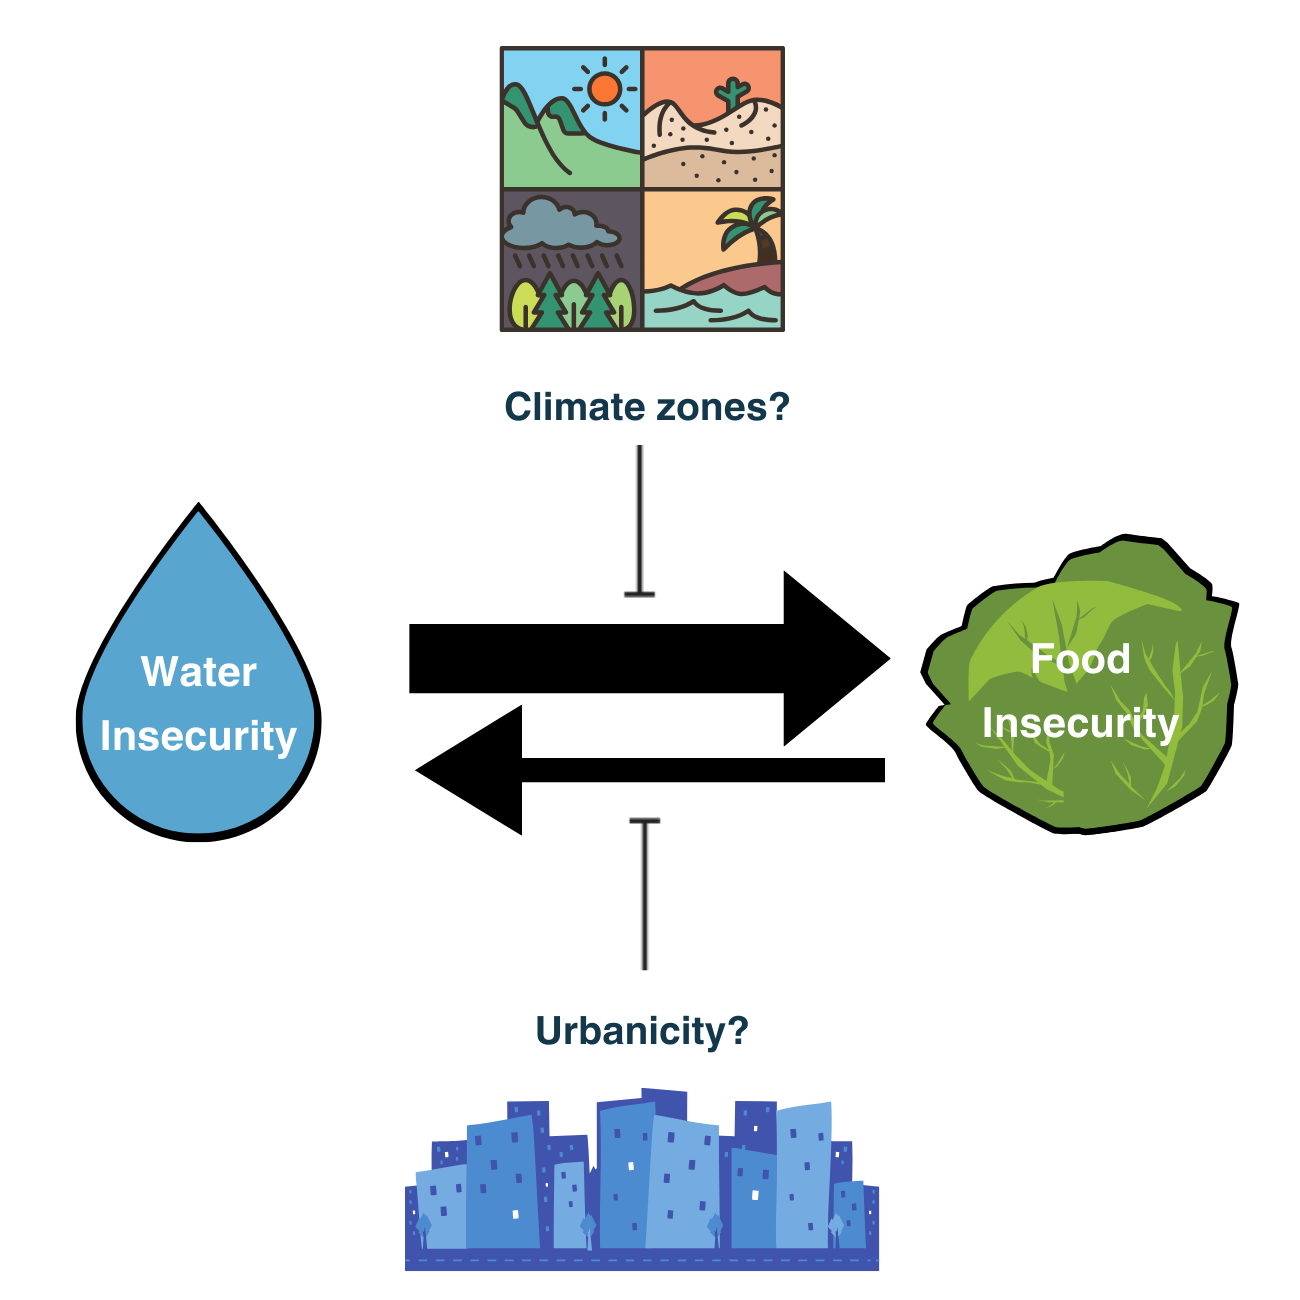
As a first step towards answering this question, we evaluated whether water and food insecurity were consistently strongly associated across climate zones and degrees of urbanicity (Figure 1). There are numerous reasons why this relationship may differ depending on the context. In urban areas, for example, prepared food may be more readily available than in rural areas, meaning that food insecurity may be more independent of water availability, access, or use. Alternatively, in tropical regions, where greater physical availability of water may ensure better food productivity, food insecurity at the household or individual level may not be as dependent on water insecurity as it is in drier regions.

We had the opportunity to explore these questions thanks to the geotagging of responses to the Gallup World Poll 2020 data. In this poll, both water insecurity and food insecurity were measured in nationally representative samples of adults from 25 low- and middle-income countries (n=31,755), using the Individual Water Insecurity Experiences (IWISE) Scale and the Food Insecurity Experience Scale (FIES) respectively; basic socio-demographic data were also collected. The geolocations of these individuals were calculated from in-person and telephone surveys, and then dislocated (to a 2 km radius in urban settings, 5 km non-urban). This allowed us to classify most individuals by Köppen-Geiger climate zones, i.e., arid, temperate, or tropical. We could also use non-dislocated geocoordinates to classify individuals as living in urban, peri-urban, or rural areas per the European Union’s degree of urbanization classification (DEGURBA). This meant that urbanicity was classified far more accurately than previously possible, e.g. here.
Using these data, we built multivariate logistic regression models to examine the association between food Insecurity and water insecurity, adjusting for key covariates (as described in Figures 2 & 3). Models were stratified by levels of urbanicity and climate zone, and took into account normalized post-stratification probability sampling weights.
Question 1: Does the relationship between water insecurity and food insecurity differ between rural, peri-urban, or urban settings?
Answer 1: We see similarly strong relationships between water insecurity and food insecurity across degrees of urbanization (Figure 2).
This relationship remained between water insecurity and food insecurity across zones regardless of whether water insecurity was classified in two categories, water secure (IWSIE score 0-11) or water insecure (IWISE score 12-36) as shown in Figure 2, or if water insecurity was classified by 4 severity levels ( IWISE score 0-2 ”secure”, 3-11 “mild”, 12-23 “moderate”, 24-36 “severe”). It is worth noting that the estimated odds ratio of food insecurity for individuals experiencing water insecurity was higher in rural settings than urban or peri-urban areas, but there was no statistical difference found between these zones. A theme for future research will be to explore how these relationships may change when more is known about other contextual factors, such as food preparation practices, distance from water sources, time use, and expenditures on food and water.

Question 2. Is the strength of the association between water and food insecurity different in arid, temperate, or tropical climate zones?
Answer 2. Water and food insecurity were strongly positively associated across all three climate types (Figure 3).
There was no difference found between the associations by climate zones in this sample, but the estimated odds of being food insecure if experiencing water insecurity was slightly higher in arid zones (though not statistically different). It will be interesting to see if different relationships emerge in other samples, including in studies with data that cover all 5 Köppen-Geiger climate zones.

Caveats
This is the first investigation of how urbanicity and climate zones may alter the relationships between water and food insecurity; these analyses are far from conclusive. For one, these data come from samples in 25 low- and middle-income countries; this relationship may not hold in high-income countries. Furthermore, sampling in Gallup World Poll is done to achieve national representativeness but not to represent climate zones. As such, two climate zones (polar and continental groups), as well as climate sub-groupings could not be included due to small sample sizes (< 1000). Moreover, these select countries are not necessarily representative of all the countries in the world that are classified within these climate zones. Because of the COVID-19 outbreak, most of the Gallup World Poll data were collected via phone surveys. This data collection approach may result in imprecise localization of respondents (prior to the dislocation procedures used to ensure anonymity) and potential misclassification of some respondents’ urbanicity and climate zones. Additional research may be needed to ensure that IWISE score thresholds for defining water insecurity are appropriate. Finally, more information about mechanisms by which water and food insecurity are associated would be valuable.
Take homes
Despite previous research suggesting water issues tend to be more common in rural and arid settings, these data show that water insecurity is also consistently strongly associated with food insecurity in urban and non-arid climate zones. These findings add to the growing body of research suggesting that addressing water insecurity is necessary to improve food insecurity across contexts, accentuating this year’s World Food Day’s theme that “Water is life, water is food”.
[1] Water insecurity was defined as an IWISE score of 12-36 (versus 0-11); moderate-to-severe food insecurity was defined as a FIES Rasch-equated probability parameter of ≥ 0.5. Odds ratios and 95% confidence intervals were estimated using stratified multivariable logistic regression models for each category of urbanicity. These models tested for the association between water insecurity and food insecurity while accounting for normalized post-stratification probability sampling weights and adjusting for income, difficulty getting by on income, sex, household size, age, employment, marital status, impacts of COVID on life, and country.
[2] Water insecurity was defined as an IWISE score of 12-36 (versus 0-11); moderate-to-severe food insecurity was defined as a FIES Rasch-equated probability parameter of ≥ 0.5. Odds ratios and 95% confidence intervals were estimated using stratified multivariable logistic regression models for each category of climate zone. These models tested for the association between water insecurity and food insecurity while accounting for normalized post-stratification probability sampling weights and adjusting for income, difficulty getting by on income, sex, household size, age, employment, marital status, impacts of COVID on life, urbanicity, and country.


