Introduction
Unhealthy dietary patterns have long been linked with increased risk of non-communicable disease. Many countries have developed food-based dietary guidelines (FBDGs) to provide their residents with evidence-based guidance on food choices for better health. However, people may be unable to follow a healthy diet even if they would like to do so. One important factor in the accessibility of healthy diets is whether or not they are affordable, especially for low-income consumers. How do international organizations monitor the affordability of healthy diets? This blog post explains the data and methods behind the metrics that capture this critical dimension of food access.
The 2023 edition of the State of Food Security and Nutrition in the World (SOFI) report included the headline finding that more than 3.1 billion people were not able to afford a healthy diet in 2021. The Food Prices for Nutrition project developed these indicators, which are also available online through the World Bank’s Food Prices for Nutrition DataHub.

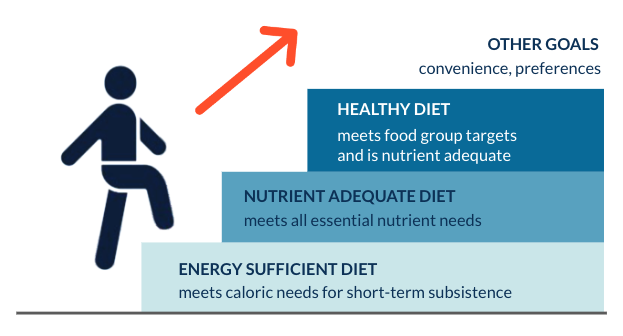
Figure 1. The ladder of diet affordability. Source: https://sites.tufts.edu/foodpricesfornutrition/methods/
The Healthy Diet Basket
As Figure 1 illustrates, a healthy diet goes beyond energy and essential nutrient requirements to include a variety of recommended food groups. When calculating CoAHD for a given country, that country’s FBDG can serve as the standard for a healthy diet. However, when making comparisons across countries, it’s best to use a global standard that represents the least-common denominators across most national FBDGs. The global standard used for the SOFI report is the Healthy Diet Basket (HDB), which includes reference intakes in calorie terms for six food groups: starchy staples; animal source foods; legumes, nuts, and seeds; vegetables; fruits; and oils and fats. Eleven food items across the six recommended food groups provide a total of 2330 kcal per day, which represents the average energy requirements for a young active woman.

Table 1. Content of the Healthy Diet Basket (HDB). Source: Herforth et al, 2022
Calculating the Cost of a Healthy Diet
The cost of a healthy diet (CoHD) is calculated by identifying the least-cost items within each HDB food group on a cost per day basis, then adding up the total cost per day to purchase all 11 items. For the SOFI report, the cost of each individual food group is calculated using retail food price data in local currency units from the World Bank’s International Comparison Program (ICP). This metric highlights how certain food groups contribute more to diet costs and may present the greatest challenge to the affordability of healthy diets.
Retail food price data from ICP are not updated annually, so Consumer Price Index (CPI) data from FAO must be used to adjust prices for inflation when calculating diet costs in years between ICP rounds. The best option is to use food CPI data, which are tailored to inflation across food and non-alcoholic beverages. For SOFI 2023, this meant using 2021 food CPI to inflate ICP retail prices from 2017. This cost is then converted from local currency units into international dollars using purchasing power parity (PPP) exchange rates to facilitate cross-country comparison. Since FAO’s food CPI data are not available for individual food groups, this method only works for adjusting total diet costs for inflation.
Applying the CoHD Indicator
After calculating the cost of a healthy diet, it’s possible to estimate the percentage and the number of people in a country or globally who are unable to afford that cost. The first step is to determine a cutoff point for affordability. Around the world, the average low-income consumer devotes about 52 percent of their expenditures to food. As a result, if a healthy diet costs more than 52 percent of a country’s average income, then it is unaffordable. Comparing the cost of a healthy diet in a given country with its income distribution from the World Bank’s Poverty and Inequality Platform (PIP) yields the percentage of people in that country who cannot afford a healthy diet. Multiply this percentage by the country’s population from the World Bank’s World Development Indicators (WDI) to calculate the number of people who are unable to afford a healthy diet in each country in the year of interest.
These indicators help guide actions to improve nutrition, especially in cases where affordability is a leading cause of poor diet quality. If even the least-cost healthy items are out of reach for low-income consumers, governments and other stakeholders can focus on identifying options to improve affordability. Targeted investments in production and supply chain improvements may reduce the cost of a healthy diet, especially for fruits, vegetables, and animal-source foods. In many cases, expanded safety nets and social assistance can improve access and diet quality by increasing consumer purchasing power.
Global rates of food and nutrition insecurity are persistently high, despite progress in many areas over time. Making healthy diets affordable is a prerequisite for improving dietary patterns and reducing the burden of diet-related chronic disease. This means it is critical to know how many people cannot afford a healthy diet and to monitor the cost of a healthy diet on a yearly basis. With increased adoption of these metrics, policymakers and stakeholders will be better able to bring healthy diets within reach of those in greatest need.
For a more detailed explanation of CoAHD indicators, please refer to the method section of the Food Prices for Nutrition website.

